
Benchmark Testing
Testing dBSea’s Solvers in Multiple Comparisons with Well-Known Benchmark Problems
Section titled “Testing dBSea’s Solvers in Multiple Comparisons with Well-Known Benchmark Problems”We here present solutions to a range of well-defined underwater sound propagation calculation problems for the comparison of dBSea’s algorithms to the open-source method based on the same modelling approach.
Many of the examples will link to “UWA” files. These are dBSea scenario files that can be viewed in dBSea BASIC (freely available from: dBSeaBasic-236.zip).
Please note that while ray tracing methods have been included in this document for the sake of completeness, they are generally not suitable for low-frequency problems (wavelength > 1–3% of depth).
1. Upslope Wedge
Section titled “1. Upslope Wedge”1.1 ASA Benchmark
Section titled “1.1 ASA Benchmark”The ASA Benchmark problems (Jensen & Ferla, 1989) represent a classic base for comparison of propagation modelling. The UWA file for this scenario is available from: UWA File
Image 1. Schematic of scenario for wedge problem
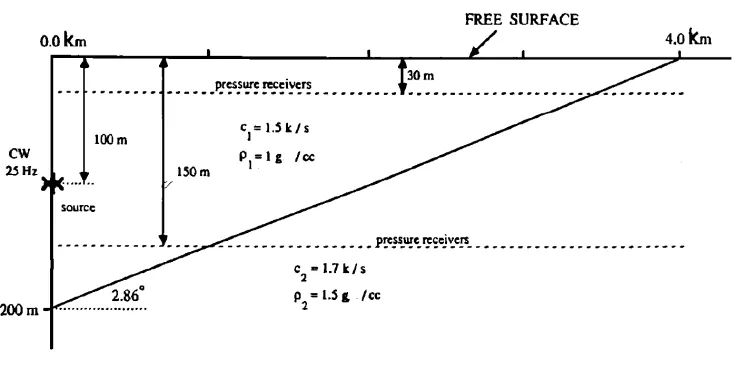
The following results are based on a comparison of dBSea’s solvers with solvers from the AcTUP toolbox (AcTUP Toolbox), covering two of the most popular methods of calculating the sound field, namely:
- Parabolic Equation Method – dBSeaPE & RAM
- Ray Tracing Method – dBSeaRay & Bellhop
Note that the scenario is modelled for 25 Hz. At this frequency, we do not expect the two ray tracing methods to work well.
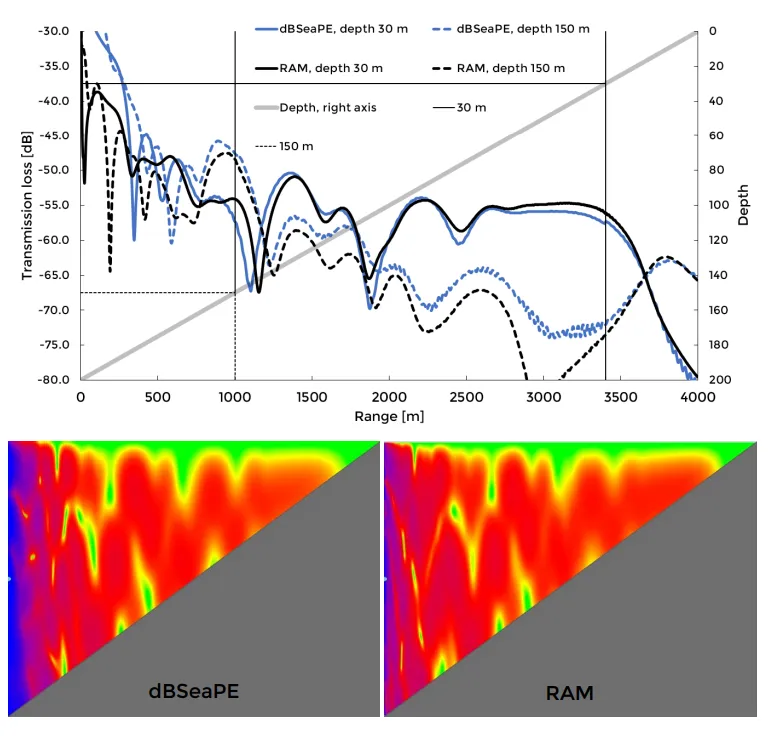
1.1.1 Parabolic Equation Method
Section titled “1.1.1 Parabolic Equation Method”Image 2. Transmission losses for dBSeaPE and RAM. Depths 30 m and 150 m are shown in chart, while full transects in colour are presented below.
1.1.2 Ray Tracing Method
Section titled “1.1.2 Ray Tracing Method”Image 4. Transmission losses for dBSeaRay and Bellhop. Depths 30 m and 150 m are shown in chart, while full transects in colour (-20 dB to -70 dB) are presented below.
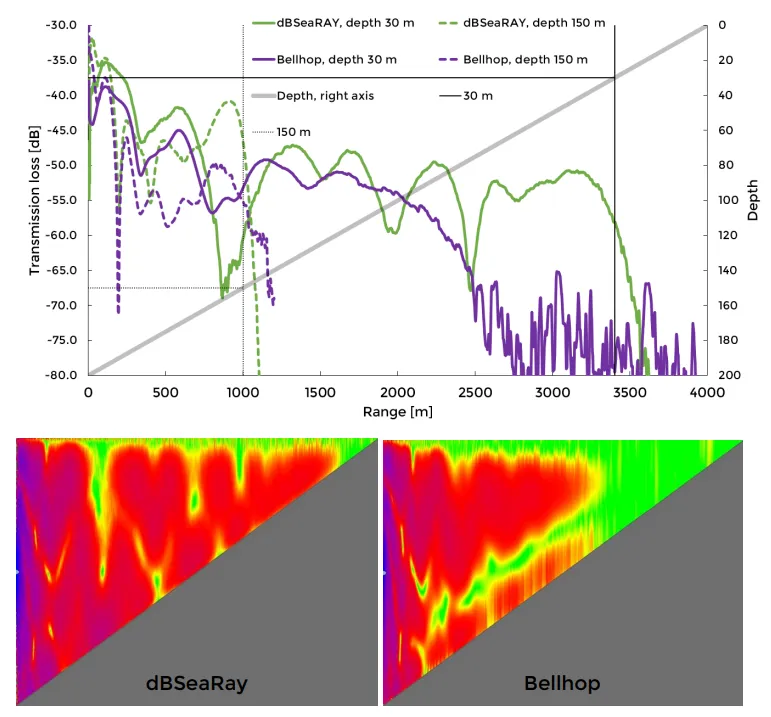
Note that neither of the ray tracing methods penetrate the sediment, and so the receiver depth at 150 m terminates shortly after a range of 1000 m. Notice that dBSeaRay reproduces the results well from the parabolic equation method, despite being unsuitable for the chosen frequency (25 Hz).
2. Up-Down Energy Conservation Problem
Section titled “2. Up-Down Energy Conservation Problem”2.1 Parabolic Equation Workshop II 1993 – Case II
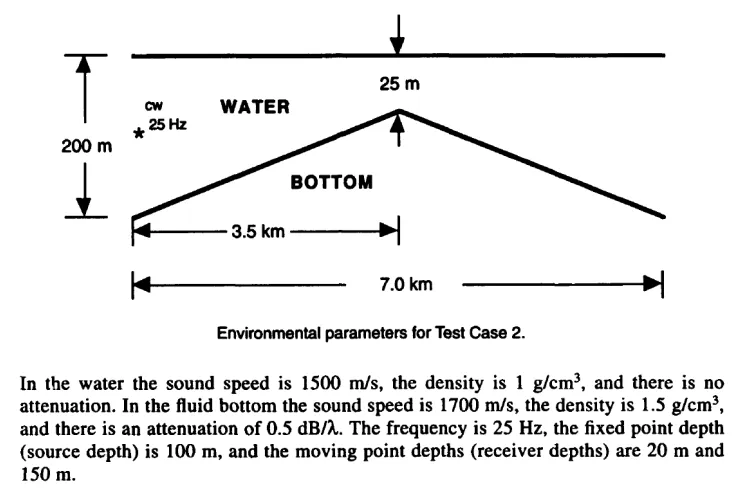
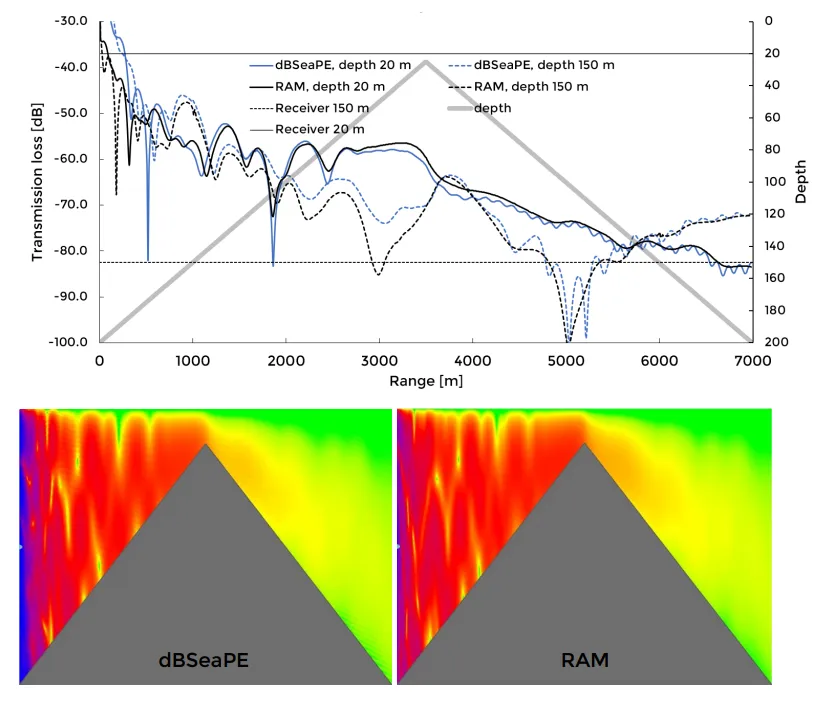
Section titled “2.1 Parabolic Equation Workshop II 1993 – Case II”An upslope-downslope problem formulated to test the energy conservation in strongly range-dependent environments was formulated in (Chin-Bing et al., 1993). The UWA file for this scenario is available at: UWA File
Image 5. Schematic outlining upslope-downslope problem.
2.1.1 Parabolic Equation Method
Section titled “2.1.1 Parabolic Equation Method”Image 6. Transmission losses for dBSeaPE and RAM. Depths 20 m and 150 m are shown in chart, while full transects in colour are presented below.
3. Flat-Bottomed Waveguide
Section titled “3. Flat-Bottomed Waveguide”3.1 Pekeris Problem
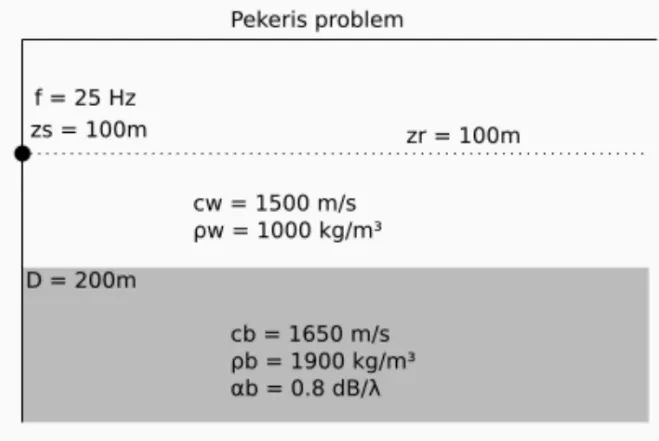
Section titled “3.1 Pekeris Problem”The Pekeris problem is a horizontally flat waveguide, designed to test propagation in an environment with a moderately absorbent sediment. See here for details about the Pekeris Problem
3.1.1 Parabolic Equation Method
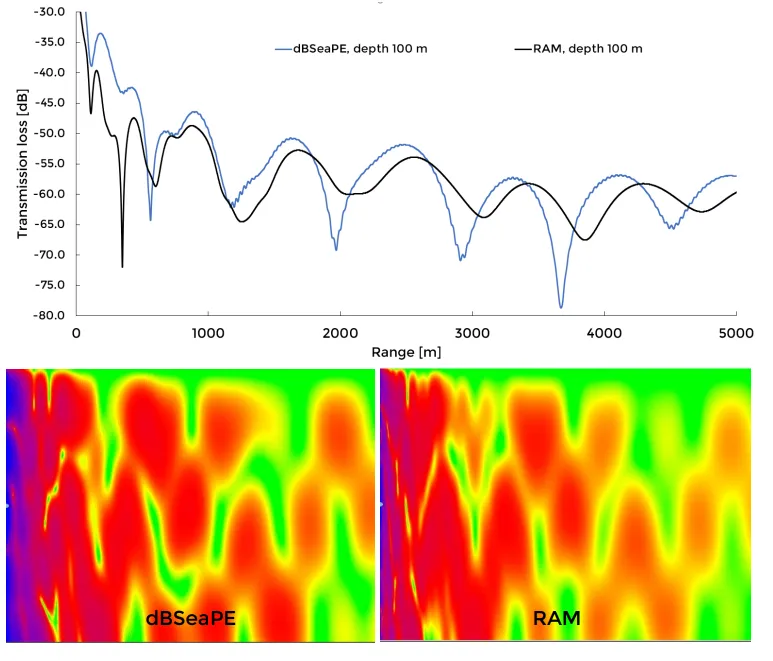
Section titled “3.1.1 Parabolic Equation Method”Image 9. Transmission losses for dBSeaPE and RAM. Depth 100 m is shown in chart, while full transects in colour are presented below.
3.1.2 Ray Tracing Method
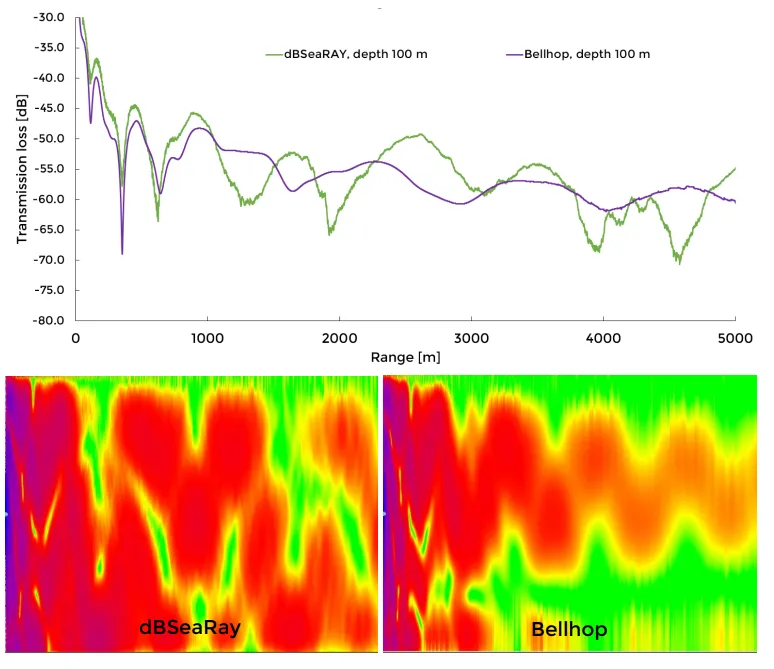
Section titled “3.1.2 Ray Tracing Method”Image 11. Transmission losses for dBSeaRay and Bellhop. Depth 100 m is shown in chart, while full transects in colour are presented below.
4. References
Section titled “4. References”- Chin-Bing, S. A., King, D. B., Davis, J. A., & Evans, R. B. (1993). PE Workshop II. Stennis: Naval Research Laboratory.
- Jensen, F. B., & Ferla, C. M. (1990). Numerical solutions of range-dependent benchmark problems in ocean acoustics. Journal of the Acoustical Society of America, 87(4), 1499–1510.